Home
/
News
/
The Color in Your Cup
The Color in Your Cup
by Imelda Ball
July 08, 2022
The Color in Your Cup: Roast Level and Brew Temperature Significantly Affect the Color of Brewed Coffee

Lead author SARA YEAGER shares the findings of a recently published paper, “Roast Level and Brew Temperature Significantly Affect the Color of Brewed Coffee,” published in the Journal of Food Science, exploring how coffee beverage color varies with origin, roast level, and brew temperature.
Before a cup of coffee even touches our lips for a sip, we gather a tremendous amount of information about the way it will taste. We smell the aromatics—a good indicator of the flavors inside—and we might feel the tactile sensation of the warm mug in our hands, a good indicator of its temperature. We also see the coffee, too! As we hold the cup in our hands, we consciously (or subconsciously!) evaluate the visual aspects of the coffee: its hue, its depth of color, its transparency or opacity. But what does the appearance of the coffee tell us, and why is it important?
We know that the color of coffee is important to coffee consumers. In the National Coffee Association’s National Coffee Data Trends study, the level of roast—a value generally expressed in color terms (light, medium, dark)—is the most impactful factor on purchase intent of a coffee. These color words, associated with the roast flavor, are among the most important sensory attributes mentioned by consumers in the study, and the neuroscience supports this ranking: in an amazing study using virtual reality, Qian Janice Wang et. al. demonstrated that tasters perceived differences in flavor in identical coffees when only the appearance of the coffee—in virtual reality—was altered. This suggests that coffee’s appearance can affect the perception of coffee at the neurological level, a phenomenon researchers refer to as the “crossmodal effect.”
And, as coffee experts, we know this is true. A coffee beverage’s color gives us key insights into the chemical makeup of the beverage itself, and gives us valuable clues into the flavors we might expect. A dark black coffee is likely to be bitter and intense, a reddish-brown coffee is likely to be tea-like and bright. One reason for this, as Sara Yeager explains in the following piece, might be melanoidins, a group of compounds formed during roasting. These brown-colored compounds are known to affect flavor and aroma in foods, and are a major reason why the famous “Maillard reaction” creates both brown-ness and delicious flavor in foods. Melanoidins are an important feature in both coffee color and flavor, and so it stands to reason that changes in coffee color will predict differences in coffee flavor.
But what drives beverage color? In 2021, researchers at the UC Davis Coffee Center, working on a study evaluating the chemical differences between hot and cold brew, work supported by the Coffee Science Foundation and Toddy, noticed something amazing: the same coffee, brewed to the same TDS but using different water temperatures, actually looked different. Researcher Sara Yeager’s curiosity was piqued—she wondered why coffees where everything was identical apart from the brew temperature could look so different. This led Yeager and her colleagues to learn about how color measurement in coffee works and resulted in an amazing discovery: color in the cup is driven not only by roast color and strength but also by brew temperature, to the extent that one might be able to predict brew temperature by the appearance of the coffee itself.
Peter Giuliano
Coffee Science Foundation
Despite the fact that color of coffee—from beans to beverage—is an important indicator of roast level and quality across the industry, our understanding (and measurement) of color has been predominately subjective.
Quantitatively, roast color can be measured using the Agtron Gourmet Scale or using the International Commission on Illumination’s CIELAB color space, the latter of which expresses color through three values designed to approximate human vision: dark to light (L*), green to red (a*), and blue to yellow (b*). Often, these quantitative measurements are included alongside the more qualitative roast determinations, such as “light,” “medium,” or “dark.” On the consuming side, color is typically the first assessment of quality a consumer makes, making it a primary indicator of perceived quality. Additionally, changes in color of the product—such as the browning that occurs during the coffee roasting process—serve as a cue for changes in aroma and flavor. Understanding how the physiochemical makeup of coffee affects the objective measurements of color may provide insight into how consumers already use color to determine certain sensory characteristics.
When it comes to the coffee beverage, color has mainly been subjectively measured. It wasn’t so much about defining the color of the coffee beverage, but how the color of each coffee tended to differ from one sample to the next, and how the perceived differences in color affect consumers’ perception of their beverage. Systematically and quantitatively analyzing the color of the coffee brew has never been done before and may provide insights on how the color of the coffee brew from different origins is influenced by roast level and brew temperature.
In this study, we measured the color of Toddy-style full immersion brewed coffee across multiple origins, roast levels, and brew temperatures. Color was examined qualitatively, using photography and absorbance spectra, but, most importantly, color was also examined quantitatively using the Agtron Gourmet Scale and CIELAB color measurements. We made 243 unique brews, homogenized across sets of 3 replicates, and diluted to 2% total dissolved solids (TDS). The brews were diluted uniformly to ensure that any differences in color were not due to differences in TDS. The quantitative measurements collected from the 243 brews will be used to explore how the origin, roast level, and brew temperature of coffee can affect the beverage color.
From Grinding to Brewing
First, we were curious as to whether there was any relationship between the color of the grounds and the resulting color of the brew. To understand their correlation to each other, we took both qualitative (photos) and quantitative (Agron Gourmet/CIELAB values) measurements of the grounds. Across the three origins and three roast levels we examined (El Salvador, Ethiopia, and Sumatra), the color remained similar within the same roast level across the three origins. The biggest variation of color came from the roast; as expected, light roasts were the lightest in color and dark roasts were the darkest. Quantification of the coffee grounds confirmed this, with light roasts having the highest Agtron Gourmet scores/CIELAB values and dark roasts having the lowest. Light and medium roasts had significant differences in CIELAB values between coffee grounds and whole beans, with coffee grounds being lighter in color overall.
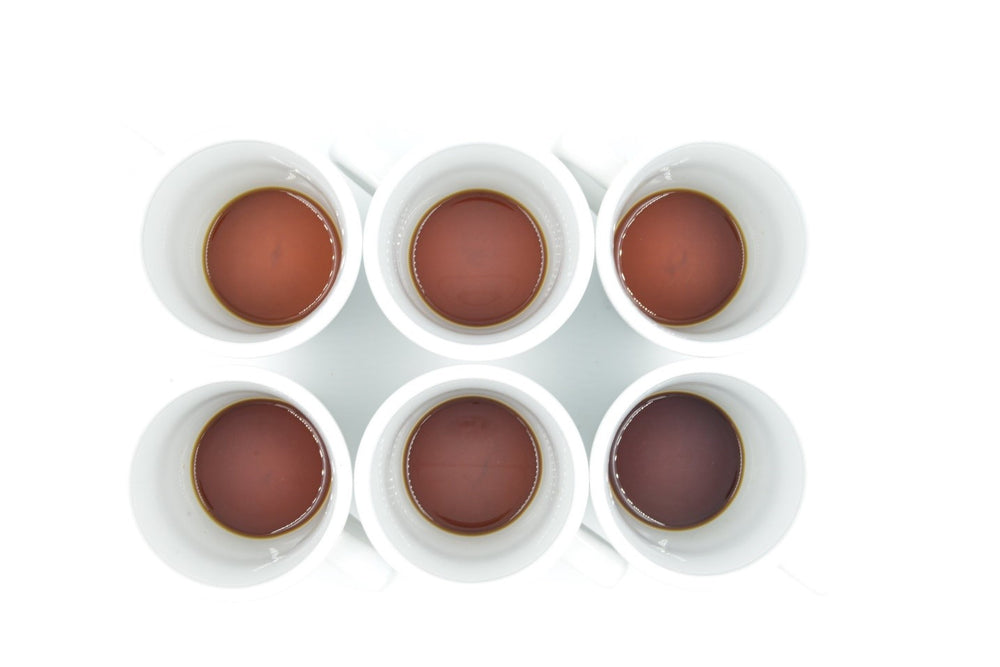
Next, we brewed the coffees at a range of temperatures and measured their color qualitatively using true color photographs: 4°C (39.2°F, fridge temperature), 22°C (71.6°F, room temperature), and 92°C (197.6°F, hot). When we examined the same spread of origins and roast levels in brewed coffee across these temperatures, it was readily apparent that the brews varied significantly in color where the grounds did not. Figure 1 shows representative photos of the brews when poured into glass test tubes or coffee mugs. The 6 sample types (of the 27 total sample types) shown were chosen to represent the wide spectrum of color present in the coffee brews. Even though the brews were diluted to uniform TDS, a wide array of colors were represented within the coffee beverage samples. The qualitatively lightest brew was a Sumatra light roast brewed at 22°C that almost looked orange in appearance (sample 4), especially when compared with the brown–black color of the El Salvador dark roast brewed at 92°C (sample 3). In general, the cold brews (4°C and 22°C) were more reddish in appearance than the hot (92°C) brews, which were browner. Additionally, the darker the roast, the darker the color of the brew, as shown in the comparison between a light, medium, and dark roast all brewed at 92°C (tubes 1–3, Figure 1A).

Figure 1A: True color images, using a natural white balance, of six representative brews placed as 5 mL in glass vials. Samples shown (origin, roast level, brew temperature): 1: Ethiopia, Light, 92°C; 2: El Salvador, Medium, 92°C; 3: El Salvador, Dark, 92°C; 4: Sumatra, Light, 22°C; 5: Ethiopia, Medium, 4°C; 6: Sumatra, Dark, 4°C.

Figure 1B: True color images, using a natural white balance, of six representative brews placed as 20 mL in white ceramic mugs. Samples shown (origin, roast level, brew temperature): 1: Ethiopia, Light, 92°C; 2: El Salvador, Medium, 92°C; 3: El Salvador, Dark, 92°C; 4: Sumatra, Light, 22°C; 5: Ethiopia, Medium, 4°C; 6: Sumatra, Dark, 4°C.
Notably, the brewed coffee exhibited a different color than the coffee grounds from which the brew was derived, with the difference depending on roast level and temperature. Brews tended to be redder, with a higher a* in CIELAB (a* measures on the green to red spectrum) than the grounds themselves. Both roast level and brew temperature affected the translation of color from the coffee grounds to the coffee brew, but there was no uniform relationship between the color of the grounds and the ultimate color the beverage would become.
Examining Color in a Three-Dimensional Space
Next, we wanted to understand if there was a relationship between the different quantitative measurements we took, so we grouped the CIELAB values of each sample across origins, roast levels, and brew temperatures. Within the light roasts, differences were much easier to distinguish between origins and brew temperatures, while dark roasts tended to be more uniform across origins and brew temperatures. Interestingly enough, a* values (corresponding to the redness of the brew) changed the least across roast levels and brew temperatures, meaning the redness tended to stay relatively consistent. Hot brews tended to have the lowest CIELAB values all around. Curiously, Sumatra room temperature brews had higher values than both the hot and fridge counterparts for all three roasts.

Figure 2: Three-dimensional plot of the CIELAB values for each sample type grouped by roast and brew temperature, with samples identified by origin (ETH = Ethiopia, ELS = El Salvador, SUM = Sumatra), roast level (L = light, M = medium, D = dark), and temperature in Celsius. The black line denotes the linear best fit, which can be described by these symmetric parametric equations in the bottom right of the image.
Since the CIELAB values exist in a three-dimensional space as a set of three coordinates, they can also be graphed in a three-dimensional space: so we mapped them! In Figure 2, each data point within the box represents the CIELAB values for that brew, with the color of the data point representative of roast level (light, medium, or dark), while the color of the text is representative of the brew temperature (4°C, 22°C, and 92°C). Across the data points, there are two groups: roast level and brew temperature. Within the three-dimensional space, brews are clustered together by roast level, with the light roasts having the highest CIELAB values and dark roasts the lowest. Conversely, brews with different brew temperatures are dispersed evenly throughout; there is not a clear grouping by brew temperature across the tristimulus values.
However, there is a clear trend about where the tristimulus values lay in three-dimensional space; so much so that the color data points follow a line articulated by symmetric parametric equations.
In other words, the CIELAB values are linked in a positive linear relationship; as one of the values decreased, so did the other two. Examining the brews along this line gives insight into how brews differ from each other, too. For example, the light roast Ethiopian coffee brewed at 4°C had the largest absolute difference in CIELAB values when compared with the dark roast Sumatran coffee brewed at 4°C, placing the two brews the farthest apart in three-dimensional space. Additionally, the relative closeness in three-dimensional space can indicate how similar two brews are: the light roast Sumatra at 92°C was more like a medium roast Sumatra brewed at 4°C than a light roast Sumatra at 4°C. In other words, brewing a lighter roast at a warmer temperature resulted in a color more indicative of a darker roast than a lighter roast.
So, What Does It All Mean?
The color of the coffee beverage is strongly influenced not only by roast level but by brew temperature as well, especially within a light or medium roast. Intuitively, this makes sense, as increased roast level will lead to a darker coffee bean, which then can lead to a darker coffee beverage. What is more surprising is that brew temperature can also affect the color of the coffee brew, which is an area of coffee research that has yet to be explored even with the recent rise in popularity of cold brew. Understanding how these two factors ultimately impact the final beverage can lead to opportunities to brand and market the color of the coffee by manipulating roast level and brew temperature.
True color photos of the coffee grounds and coffee brew highlight the mystery as to how color is translated from grounds to cup. Even though the grounds for each roast appear almost identical, the coffee brews vary drastically, depending on origin and brew temperature. Through this process, we learned that while the grounds provide a foundational layer of color that is then altered during the extraction process, the color of the grounds does not directly translate into the color of the resulting brew. The differences in color in each of the coffee brews represent the visual disparity that consumers may face when sampling different beverages. As color can serve as an indicator of quality or brew strength, such large differences in color could affect the consumer’s perception of a coffee’s sensory characteristics.
One of the most noticeable differences we found between our samples was the reddish color of the cold brewed beverages. Previous research has identified that reddish colored beverages can taste sweeter and less bitter,[2] although it is unclear whether the color differences observed in our work will have as large an effect. Nonetheless, it’s reasonable to assume that differences in color among brewing temperatures may affect the perceived flavor of the beverage, especially when it comes to the redder 4°C and 22°C brews. In the coffee industry, sensory analysis is even sometimes performed under red lighting to minimize impact of sample perception.
It remains unclear just exactly what causes the differences in color between the different coffee brews across roast levels and brew temperatures. Coffee roasting does produce melanoidins, which give roasted coffee beans their brown color. These melanoidins can vary widely in size and shape depending on degree of roast and polymerization, ultimately affecting their extractability into the coffee brew. Similarly, sucrose is caramelized during roasting, creating brown-pigmented compounds (like those that make caramel brown!), which can extract differently into the coffee brew. Differences in solubility could account for differences in color across the different brew types. Further chemical research is needed to determine the root cause of color differences among different coffee brews.
The bottom line is that both roast level and brew temperature affect the coffee beverage color, but the color of the coffee grounds is not always indicative of what the brew color will be. Cold brewed coffees, brewed at either room or fridge temperature, will be more reddish in color than the typical brown–black of hot coffee. Roast level and brew temperature can be chosen deliberately to obtain a desired color of coffee brew, offering a branding and marketing opportunity not previously explored. ◇
SARA YEAGER is a coffee scientist at Toddy, LLC.
This paper was published as part of a Coffee Science Foundation and University of California, Davis Coffee Center research project, “Towards a Deeper Understanding of Cold Brew Coffee,” generously underwritten by Toddy, LLC. Learn more at coffeescience.foundation/cold-brew.
References
[1] Qian Janice Wang, Rachel Meyer, Stuart Waters, and David Zendle, “A dash of virtual milk: Altering product color in virtual reality influences flavor perception of cold-brew coffee,” Frontiers in Psychology 11 (2020), eCollection. https: //doi.org/10.3389/fpsyg.2020.595788.
[2] J. Johnson, and F. M. Clydesdale, “Perceived sweetness and redness in colored sucrose solutions,”
Journal of Food Science 47, no. 3 (May 1982): 747–752. https://doi. org/10.1111/j.1365-2621.1982.tb12706.x; J. A. Maga, “Influence of color on taste thresholds,”
Chemical Senses 1, no. 1 (January 1974): 115–119. https://doi. org/10.1093/chemse/1.1.115.


Imelda Ball
Author